Initiating Coverage | Auto Ancillary
March 13, 2015
Setco Automotive
BUY
CMP
` 242
MHCV upcycle to stoke growth
Target Price
` 286
Setco Automotive Ltd (SAL) which is the market leader in manufacture of MHCV
Investment Period
12 Months
clutches (about 65% market share) is likely to reap rich benefits of upcycle in both
the OEM (30% of sales) as well as replacement markets (70% of sales).
Stock Info
Direct beneficiary of MHCV upcycle
Sector
Auto Ancillary
After two consecutive years (FY2013 and FY2014) of a steep double-digit decline,
Market Cap (` cr)
646
the MHCV segment is on course for a cyclical upturn. The uptrend is clearly visible
with the segment reporting a growth of 13% in YTD FY2015 (April 2014 to
Net Debt (` cr)
173
January 2015). We believe the MHCV segment is well poised to maintain the
Beta
0.9
double-digit growth over the FY2015-FY2017 period due to a) Better economic
52 Week High / Low
294 / 68
outlook which is likely to generate freight revenues, b) Firming of freight rates and
Avg. Daily Volume
12,735
improvement in fleet operators’ profitability, c) Expected reduction in interest rates
which would revive the investment cycle, and d) Budgetary focus to increase road
Face Value (`)
10
network which would enhance usage of commercial vehicle (CV)s. SAL would be the
BSE Sensex
28,503
direct beneficiary of uptick in MHCV OEM demand as it commands 85% market
Nifty
8,648
share, drawing about 30% of its total revenues from the space.
Reuters Code
SETC.BO
Aftermarket and export focus to be growth drivers
Bloomberg Code
SETC@IN
Improved fleet utilization due to higher freight availability is likely to propel the
replacement demand for clutches. SAL previously used to cater to replacement
market only through the OEM authorized distribution channels. However, SAL is
Shareholding Pattern (%)
now teaming up with multi branded distributors (network partners other than the
Promoters
63.0
OEM authorised outlets) to independently tap the replacement market. These
distribution channels provide huge opportunity as SAL can effectively tap the third
MF / Banks / Indian Fls
3.8
and fourth replacement cycle for clutches which are typically done outside the
FII / NRIs / OCBs
18.4
OEM authorized dealerships. We expect SAL aftermarket segment to post a CAGR
Indian Public / Others
14.8
of ~18% over the next two years. Also, SAL is negotiating with American and
European OEM’s to commence supplies to their authorized aftermarket channels.
SAL is already supplying to these OEMs in India and is now aiming to initiate
Abs. (%)
3m 1yr 3yr
supplies to their overseas arms. We expect exports (contributing about 9% of the
revenues) to register a healthy 25% CAGR over the FY2015-FY2017.
Sensex
4.2
30.9
60.0
Setco
(3.2)
240.8
103.9
Outlook and valuation: SAL is likely to clock a 24% CAGR in revenues over the
next two years given the improvement in the MHCV OEM space and market share
gains in the replacement segment. Also, SAL’s operating margin is also expected
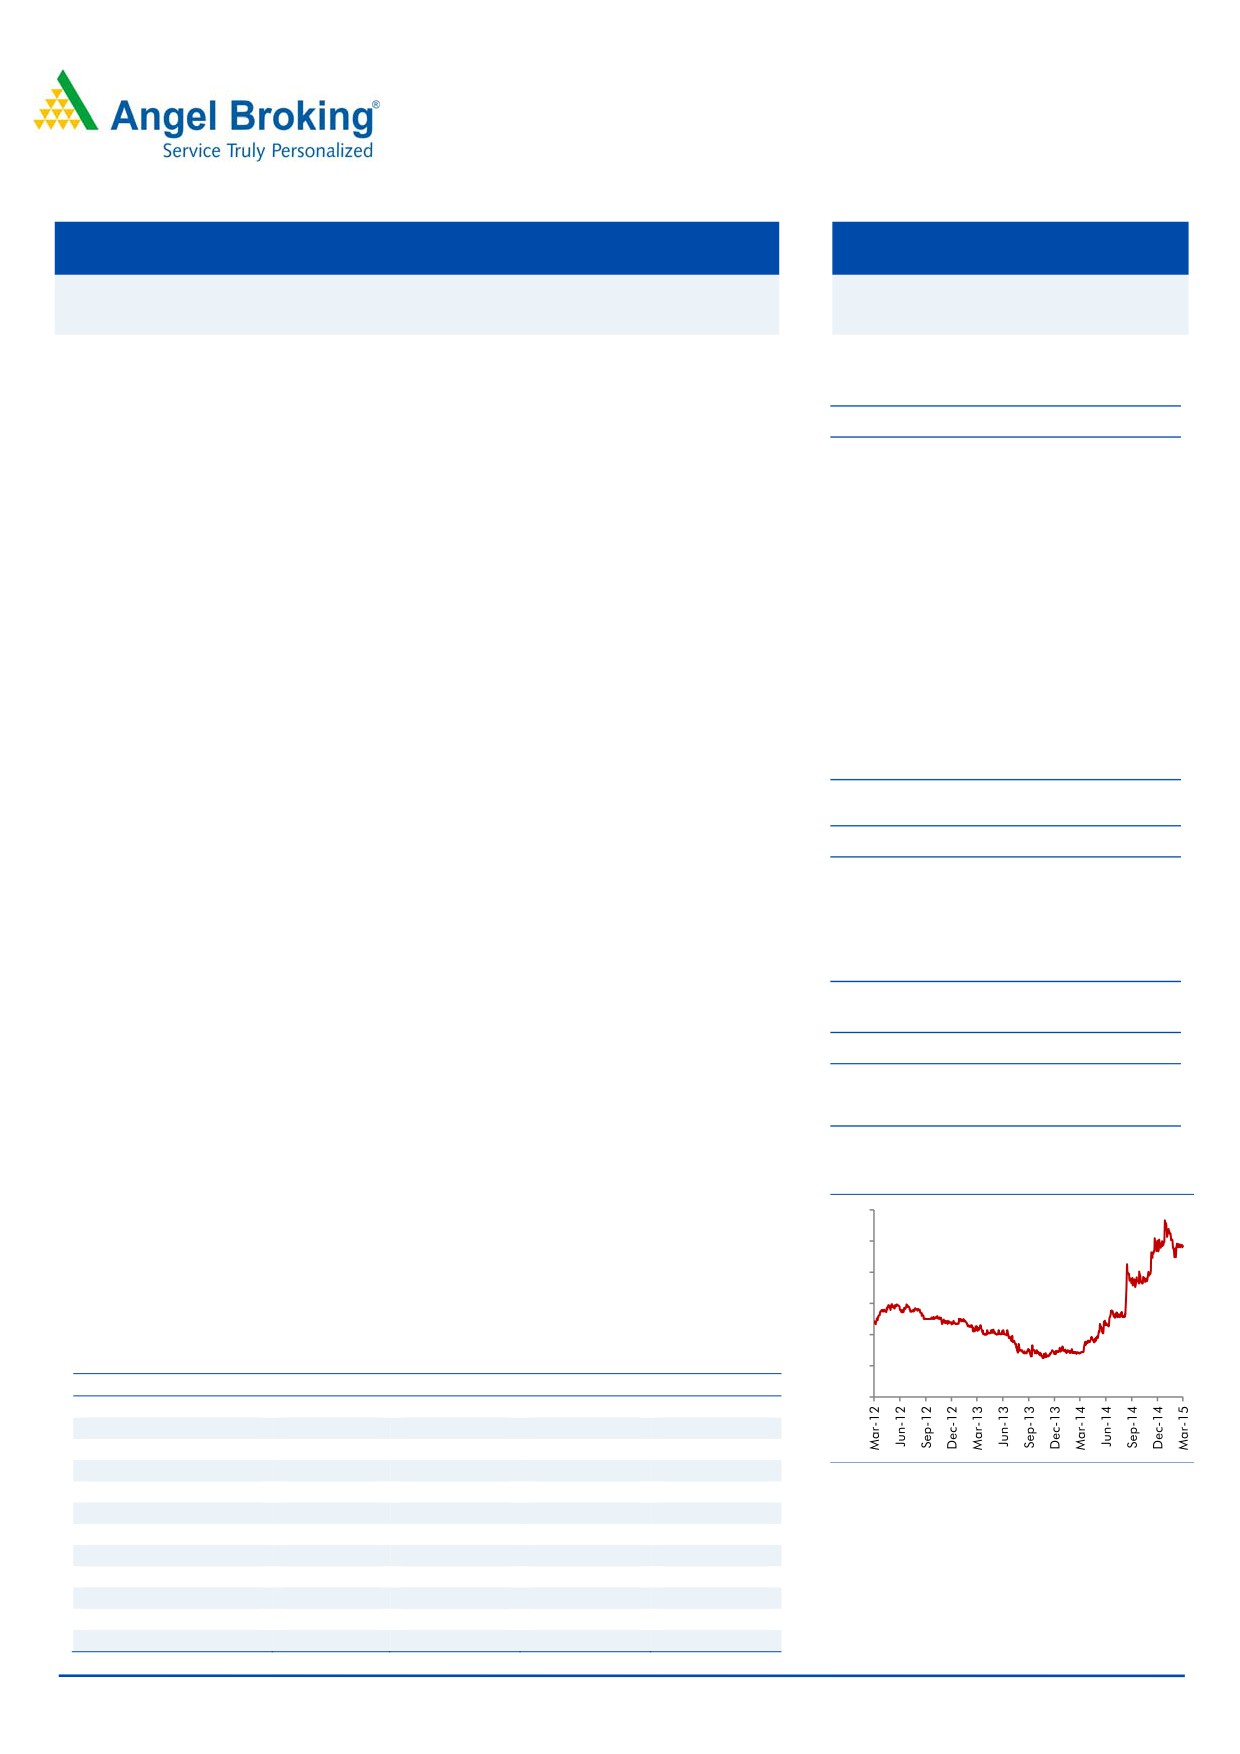
3-Year Daily price chart
to improve by 200bp over the next two years, given the operating leverage,
300
enhanced capacity utilization and procurement of captive castings. Given the healthy
250
top-line growth and margin improvement, SAL is expected to post a robust 49%
CAGR in earnings. SAL’s return ratios are also likely to expand due to improved
200
profitability and moderate capex. We initiate coverage on the stock with a Buy
150
recommendation and target price of `286 (based on 15x FY2017E earnings).
100
Key financials
50
Y/E March (` cr)
FY2014
FY2015E
FY2016E
FY2017E
0
Net sales
390
565
718
862
% chg
(2.4)
45.0
27.0
20.0
Net profit (Adj.)
11
23
36
51
% chg
(59.6)
115.9
56.4
42.5
Source: Company, Angel Research
EBITDA margin (%)
9.7
12.3
13.3
14.3
EPS (`)
4.0
8.5
13.4
19.0
P/E (x)
61.2
28.3
18.1
12.7
P/BV (x)
3.4
3.2
2.8
2.4
RoE (%)
5.6
11.2
15.4
18.6
RoCE (%)
9.0
12.3
15.1
17.4
Bharat Gianani
EV/Sales (x)
1.5
1.1
1.0
0.8
022-39357800 Ext: 6817
EV/EBITDA (x)
15.9
9.3
7.2
5.9
Source: Company, Angel Research, Note: CMP as of March 13, 2015
Please refer to important disclosures at the end of this report
1
Setco Automotive | Initiating Coverage
Investment Arguments
SAL to be direct beneficiary of MHCV upcycle
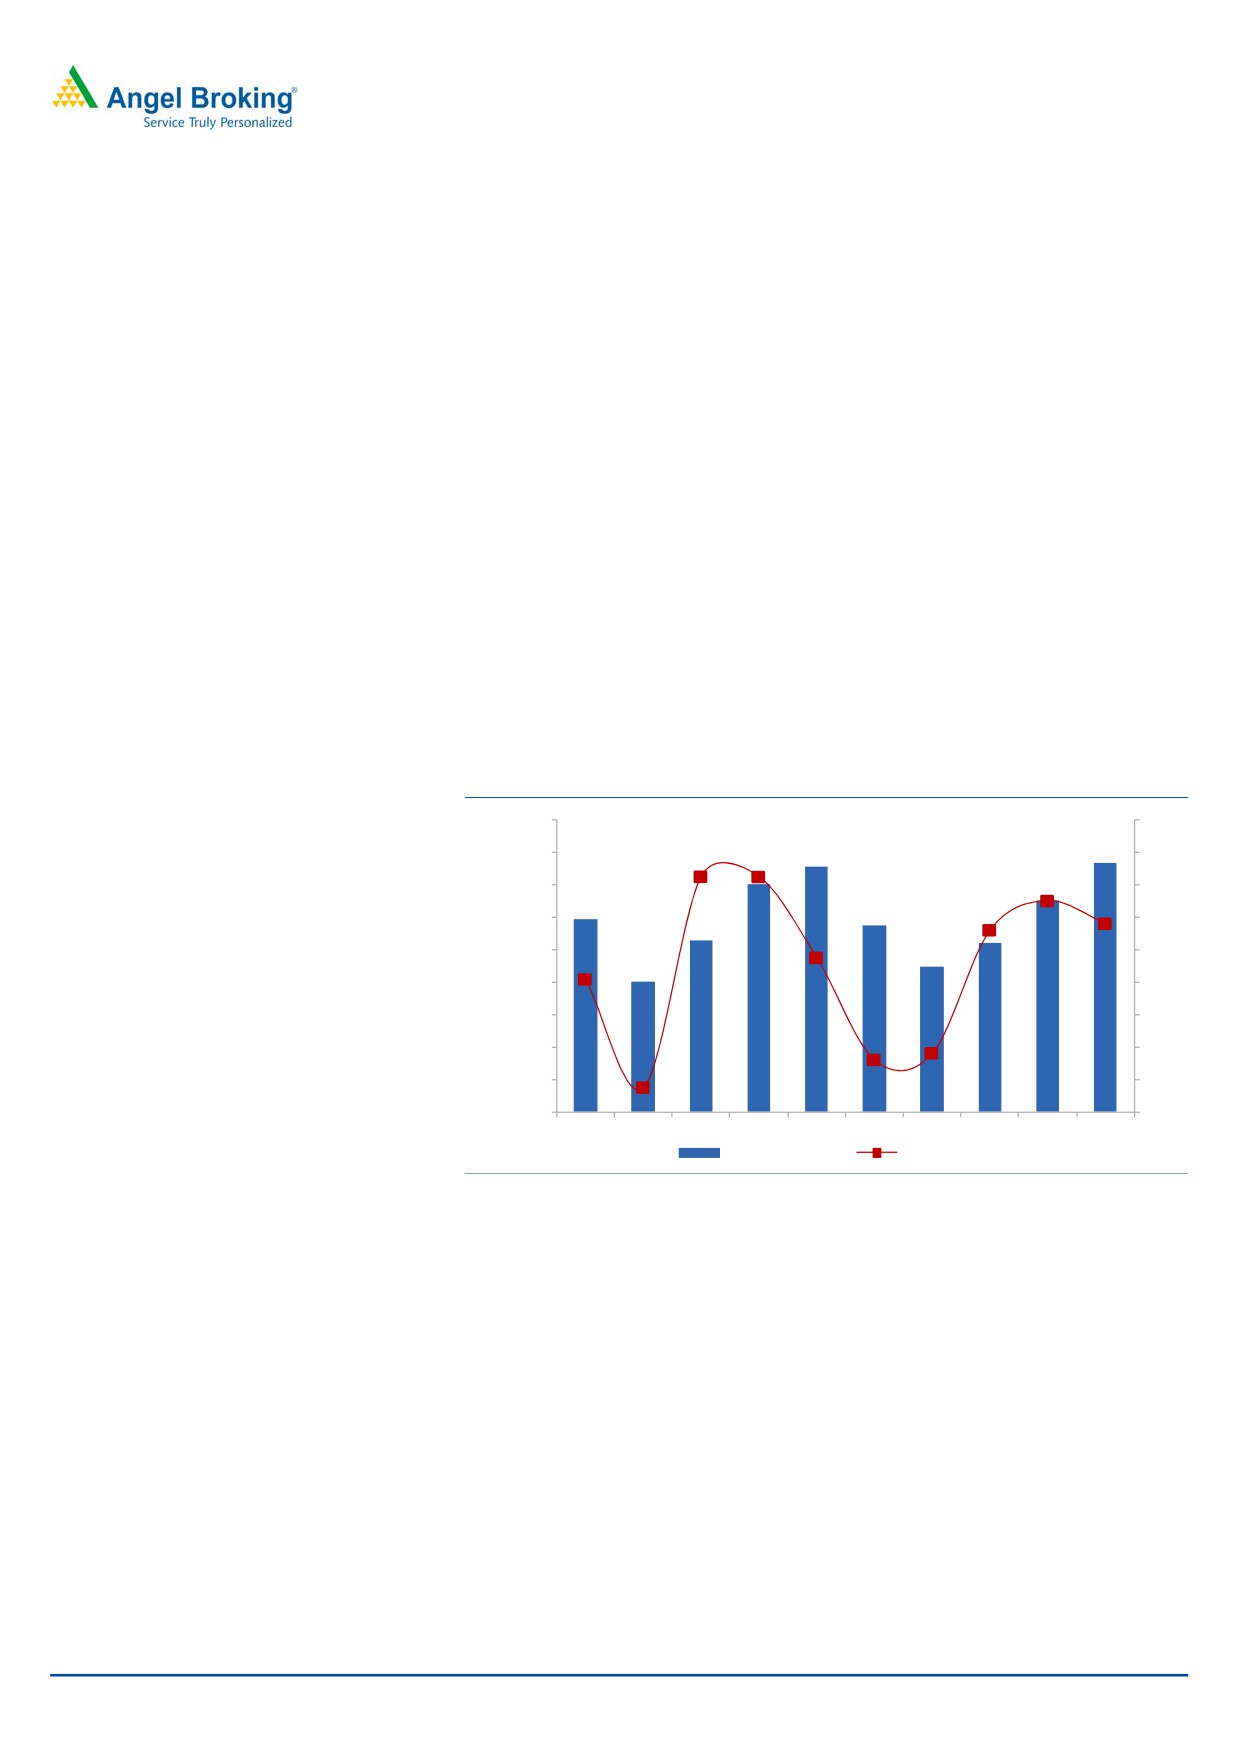
After two consecutive years of double-digit decline (FY2013 and FY2014), the
MHCV segment has resurged in FY2015. During the April 2014-December 2014
period, the segment registered a healthy growth of 13%. Improvement in the
MHCV segment can be attributed to a) Better economic growth, given the reform
driven policies of the government, b) Firming of freight rates and improved freight
availability, c) Reduction in diesel prices and lower inflation leading to
improvement in operating metrics of fleet operators, and d) Reduction in interest
rates.
Macro-economic indicators have turned favourable and we expect economic
growth to accelerate, going ahead. Further, the government’s thrust on
infrastructure (development of road network) would indirectly boost demand for
MHCVs. We believe the MHCV segment has resumed its uptrend and is well
poised to maintain double digit growth momentum over the next two years
(FY2015-FY2017). SAL would stand to be a direct beneficiary of the revival in the
MHCV OEM space as it derives about 30% of its revenues from this segment.
Exhibit 1: MHCV industry growth trends
4,50,000
50
4,00,000
40
3,50,000
30
3,00,000
20
2,50,000
10
2,00,000
0
1,50,000
(10)
1,00,000
(20)
50,000
(30)
0
(40)
FY08
FY09
FY10
FY11
FY12
FY13
FY14
FY15E FY16E FY17E
MHCV Industry
Growth %
Source: SIAM, Angel Research
Improvement in replacement demand and independent
aftermarket channel to fuel growth
Improved economic outlook and better freight availability are likely to spur
capacity utilization of the freight operators. Increased usage of vehicles would
boost replacement demand over the next two years. As per industry estimates, the
market size of the replacement segment is about 3x the size of the OEM segment.
In addition to sales through the OEM aftermarket network, SAL has tied up with
multibranded distributors (touch points other than OEM authorized channels). SAL
previously used to cater to replacement market only through the OEM authorized
distribution channels. SAL is, thus independently tapping the replacement space.
We believe this strategy provides a huge opportunity to SAL as it would enable the
company to effectively tap the third and the fourth replacement cycle of the clutch
(beyond five years of the vehicle age). This would be considering that replacements
March 13, 2015
2
Setco Automotive | Initiating Coverage
for such aged vehicles are typically carried outside the OEM’s authorised
aftermarket channels. SAL commenced its independent network in September
2013 and has already realized 10% of the revenues through this network. We
believe this strategy provides SAL with a huge untapped opportunity and would
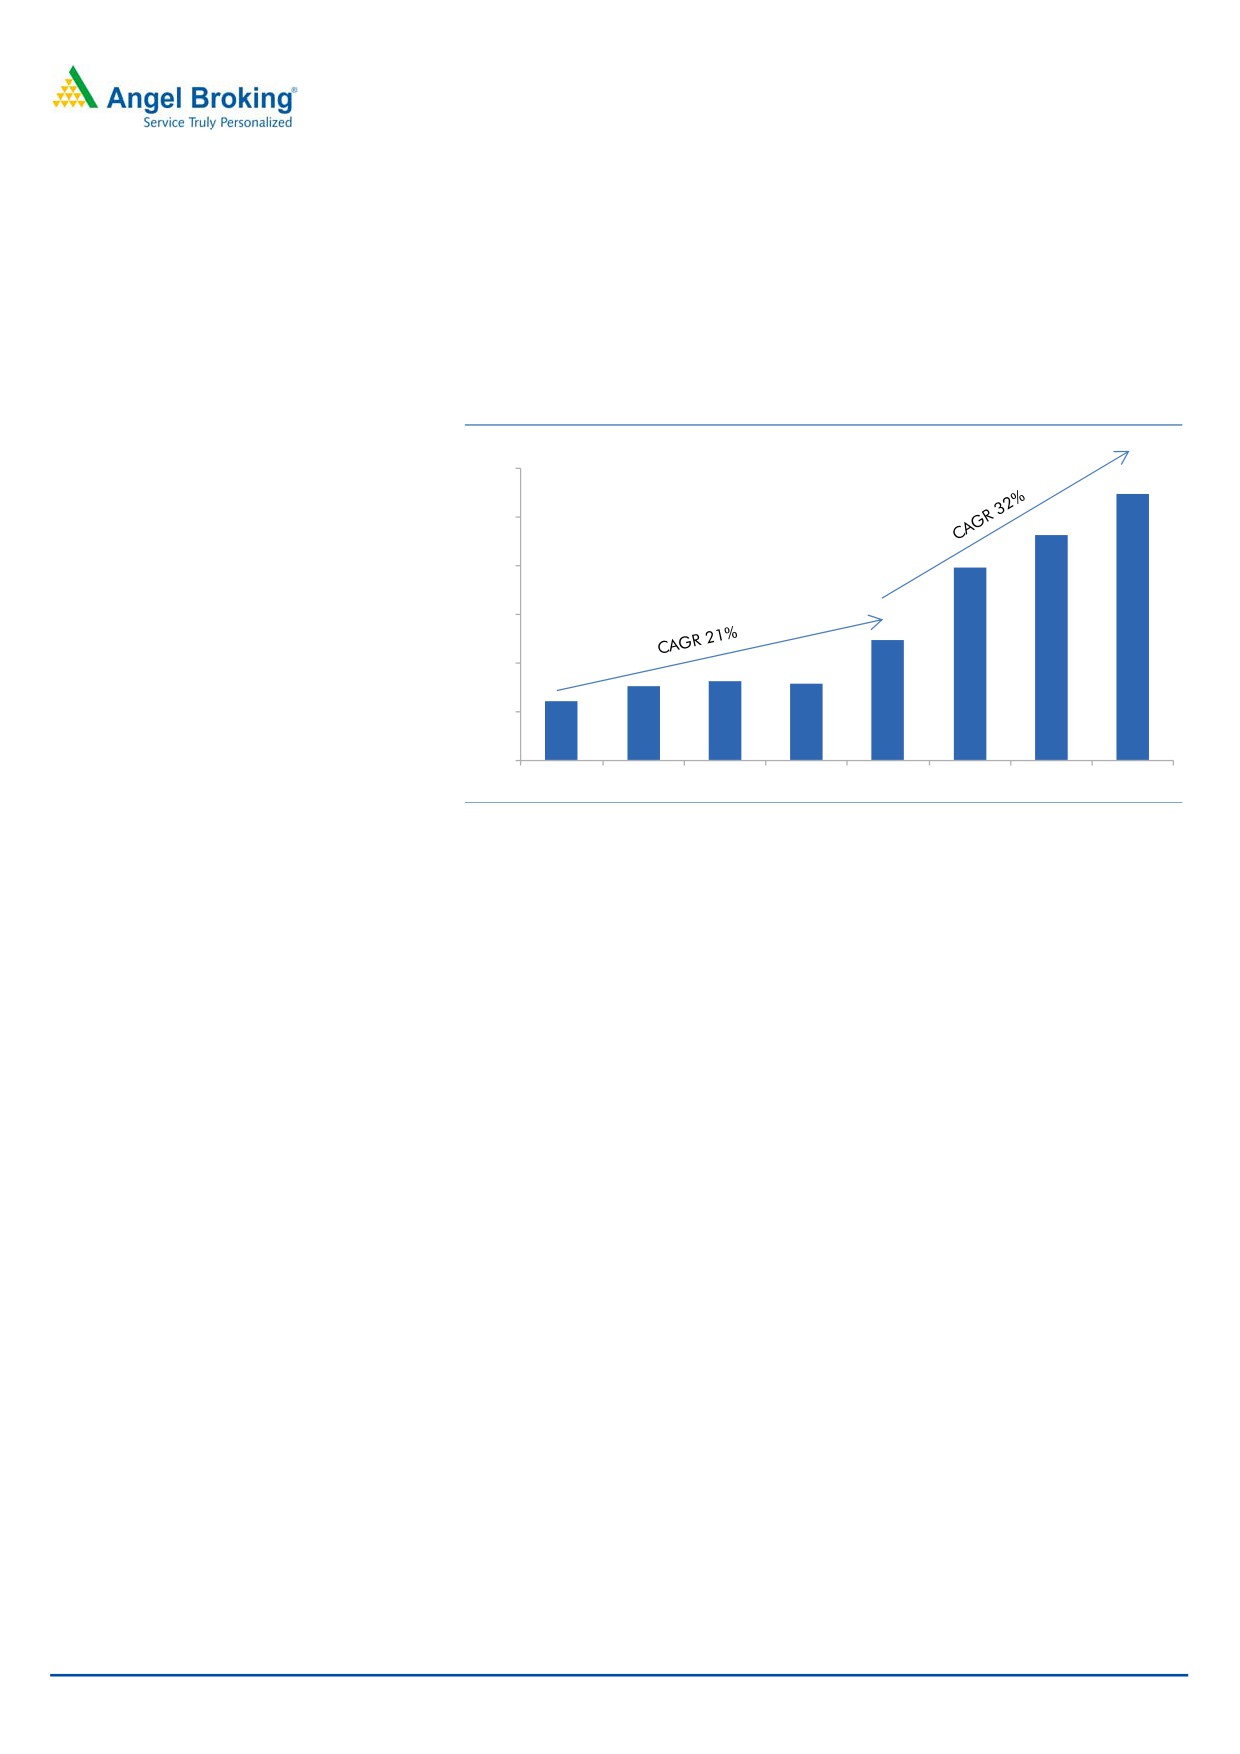
likely fuel growth. We estimate SAL’s aftermarket revenues to grow at robust 18%
CAGR over FY2015-2017 period.
Exhibit 2: SAL after market growth trend
(` cr)
600
500
400
300
200
100
0
FY10
FY11
FY12
FY13
FY14
FY15E
FY16E
FY17E
Source: Company, Angel Research
Focus on exports provides another growth lever
SAL is focusing on enhancing exports by tapping the replacement markets
overseas. To boost exports, it is focusing on three key markets viz America, Europe
and Africa. The company has developed a new product (Angular spring) for the US
markets, for which the supplies would commence from the beginning of FY2016.
SAL is targeting revenues of `150cr from the US over the next three years. Also,
SAL is in talks with the European OEMs - MAN and Bharat Benz, for the supply of
clutches through their aftermarket channels. SAL is already supplying clutches
through their aftermarket network in India and is hopeful of tapping the European
replacement segment. Apart from US and Europe, SAL is also aggressively tapping
the African market given that most of the trucks are of European make, for which,
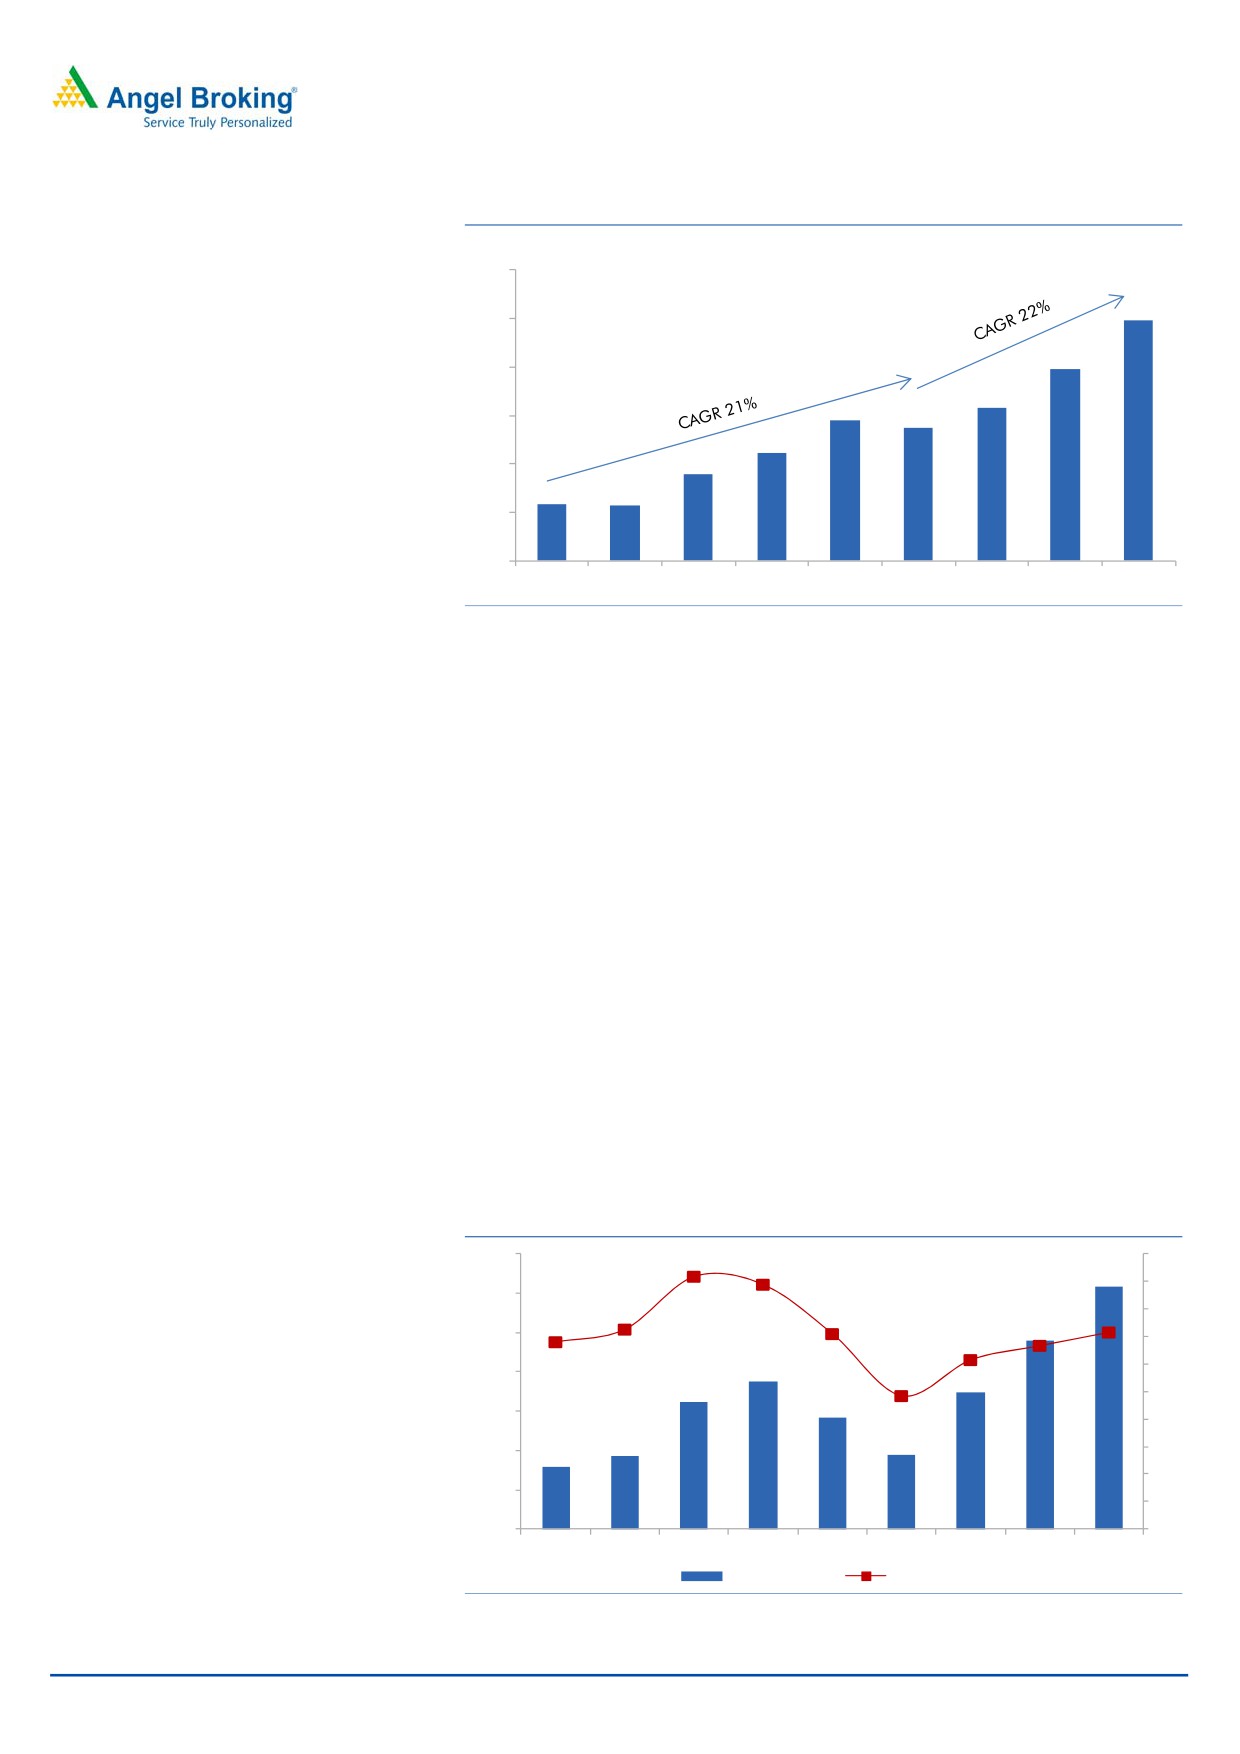
SAL already has a product. We expect SAL export revenues to grow at healthy
CAGR of 25% over the next two years
March 13, 2015
3
Setco Automotive | Initiating Coverage
Exhibit 3: SAL export growth trend
(` cr)
60
50
40
30
20
10
0
FY09
FY10
FY11
FY12
FY13
FY14
FY15E FY16E FY17E
Source: Company, Angel Research
Operating leverage coupled with backward integration to
enhance margins
SAL’s revenues are likely to grow at a CAGR of 24% over FY2015-FY2017 given
the upcycle in the MHCV OEM segment and healthy growth in the replacement
market due to economic revival and with the company setting up an independent
network. Further, SAL is currently operating at capacity utilization of about 65%.
SAL is likely to realize benefits of operating leverage given the uptick in volumes
and higher capacity utilization.
Also, SAL has entered into a JV with Lingotes Especiales S.A., a Spanish firm, for
the manufacture of machined castings which are critical in the manufacture of
clutches. The JV has planned to incur a capex of `150cr and production is slated
to commence in March 2015. About 35% of the production would be used for
SAL’s captive consumption and the remaining would be sold outside. Apart from
margin improvement due to captive production, SAL would also benefit from timely
procurement. We expect SAL’s margins to improve by about 200bp over the next
two years.
Exhibit 4: EBIDTA margin trend
140
20
18
120
16
100
14
12
80
10
60
8
40
6
4
20
2
0
0
FY09
FY10
FY11
FY12
FY13
FY14
FY15E FY16E FY17E
EBIDTA (` cr)
Margin (%)
Source: Company, Angel Research
March 13, 2015
4
Setco Automotive | Initiating Coverage
Increased supplies to LCV and farm equipment segment provides
diversification
SAL derives more than 90% of its revenues from the MHCV segment. The MHCV
segment is cyclical in nature having direct relation with economic growth. Any
slowdown in the economy impacts freight availability, thereby leading to negative
sentiments and steep decline in MHCV sales (sales have declined in double-digits
in the previous down cycles). In order to diversify and reduce volatility in revenues,
SAL is increasing supplies to the less cyclical LCV and farm equipment segments.
SAL can easily scale up presence in the LCV space given that most of its existing
customers viz Tata Motors, Ashok Leyland, Eicher are already present in the LCV
segment and SAL has well established relations with these OEMs. To further
diversify, SAL would also commence supplies to the tractor segment.
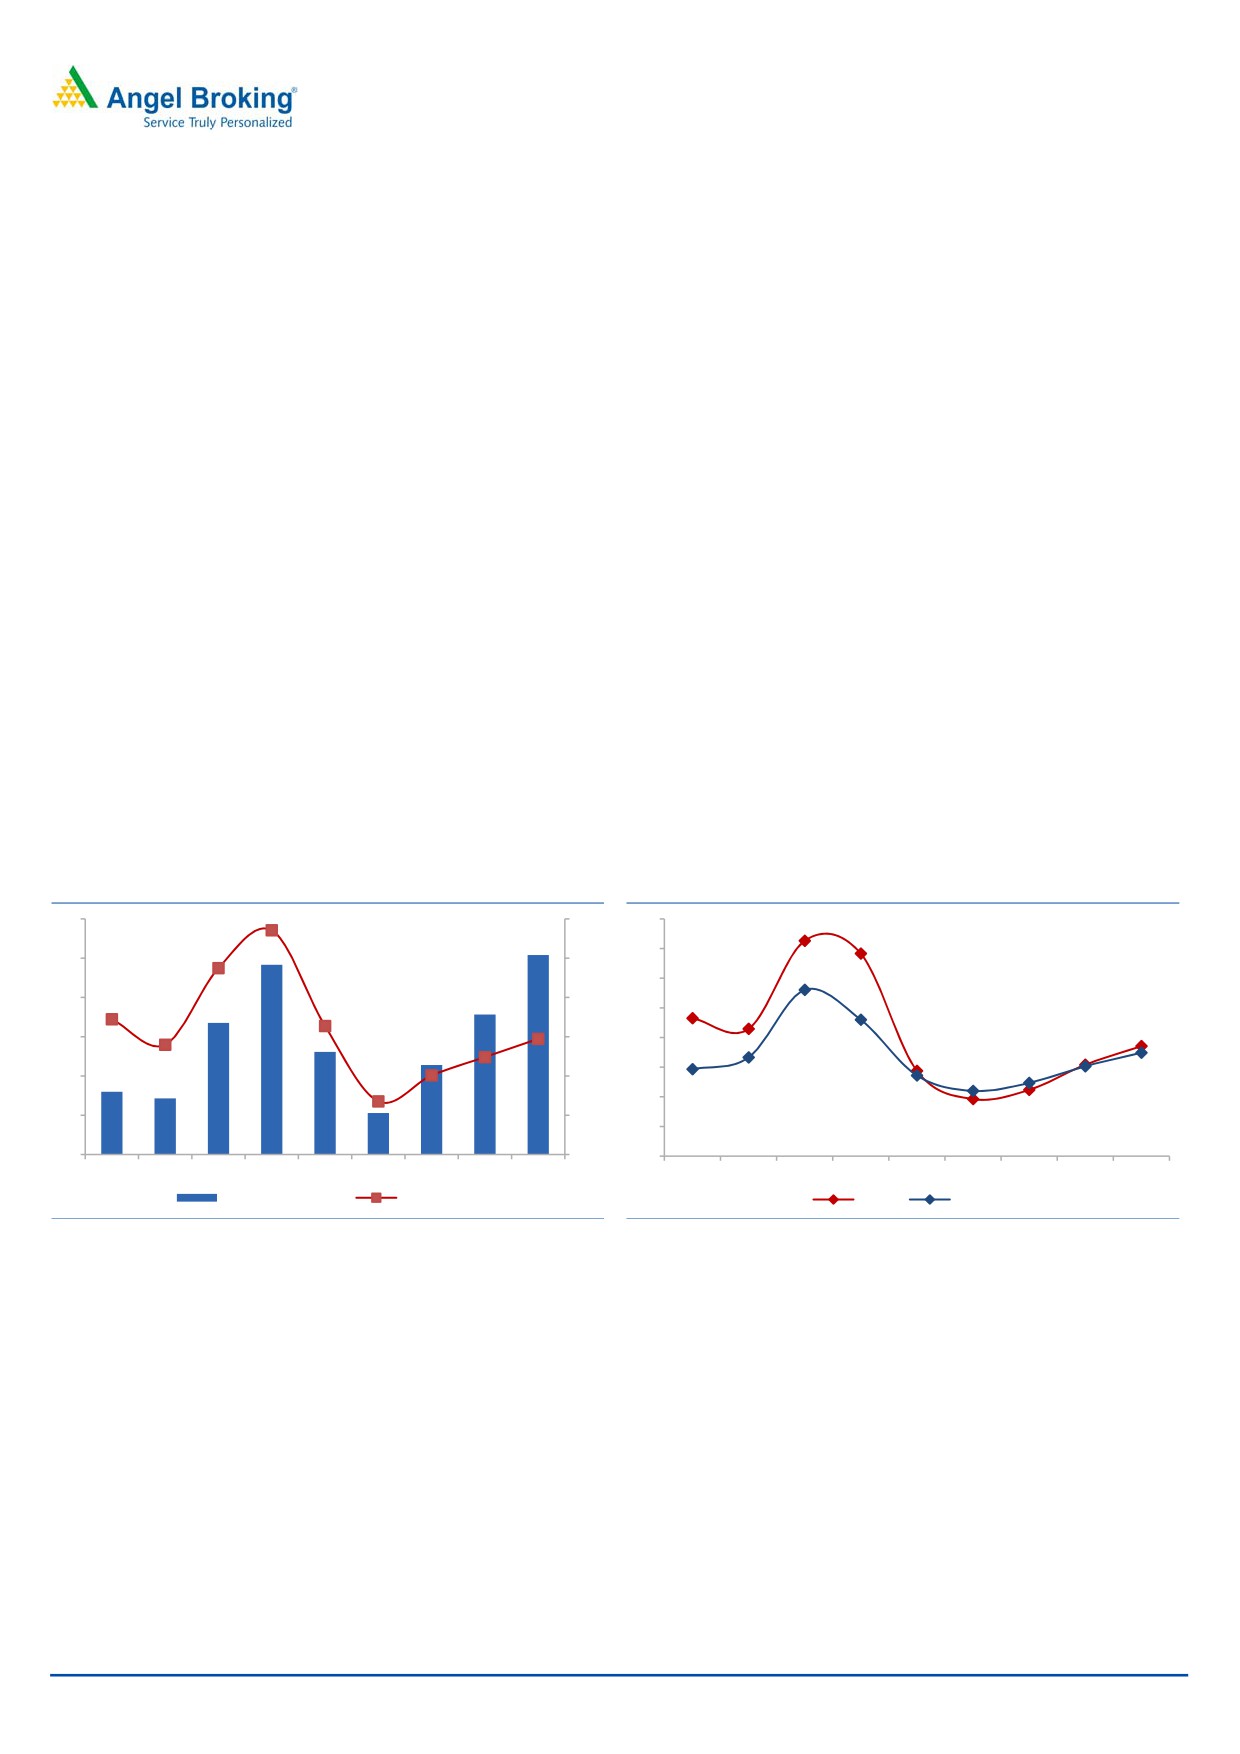
Improving margins and capacity utilization to boost return ratios
SAL’s margins are likely to improve by 200bp over FY2015-17 on back of
operating leverage and backward integration. Further, capacity utilization levels
would also increase from about 65% currently to about 90% levels by FY2017.
Also, SAL has no major capex lined up over the next two years, which would
augment the asset turnover ratios. These factors are expected to boost the return
ratios. RoE is expected to improve from 11% in FY2015 to 19% levels in FY2017.
Similarly the RoCE is expected to improve from 12% in FY2015 to 17% in FY2017.
Exhibit 5: Net Profit and margin trend
Exhibit 6: Return ratios
60
12
40
35
50
10
30
40
8
25
30
6
20
15
20
4
10
10
2
5
0
0
0
FY09
FY10
FY11
FY12
FY13
FY14
FY15E FY16E FY17E
FY09
FY10
FY11
FY12
FY13
FY14
FY15E FY16E FY17E
Net Profit (` cr)
Margin %
RoE%
RoCE%
Source: Company, Angel Research
Source: Company, Angel Research
Outlook and Valuation
SAL is likely to clock a 24% CAGR in revenues over the next two years. Revenues
are expected to be driven by an upcycle in the MHCV OEM segment, coupled with
the company setting up independent aftermarket outlets, and with the company’s
increased focus on exports. Further, the joint venture with Lava Cast for casting
supplies provides additional growth prospects to the company. SAL’s operating
margin is also expected to improve by 200bp over the next two years, given the
operating leverage, enhanced capacity utilization and procurement of captive
castings. Given the healthy top-line growth and margin improvement, SAL is
expected to post a robust 49% CAGR in earnings. SAL’s return ratios are also likely
to expand due to improved profitability and moderate capex. We initiate coverage
on the stock with a Buy recommendation and target price of `286 (based on 15x
FY2017E earnings).
March 13, 2015
5
Setco Automotive | Initiating Coverage
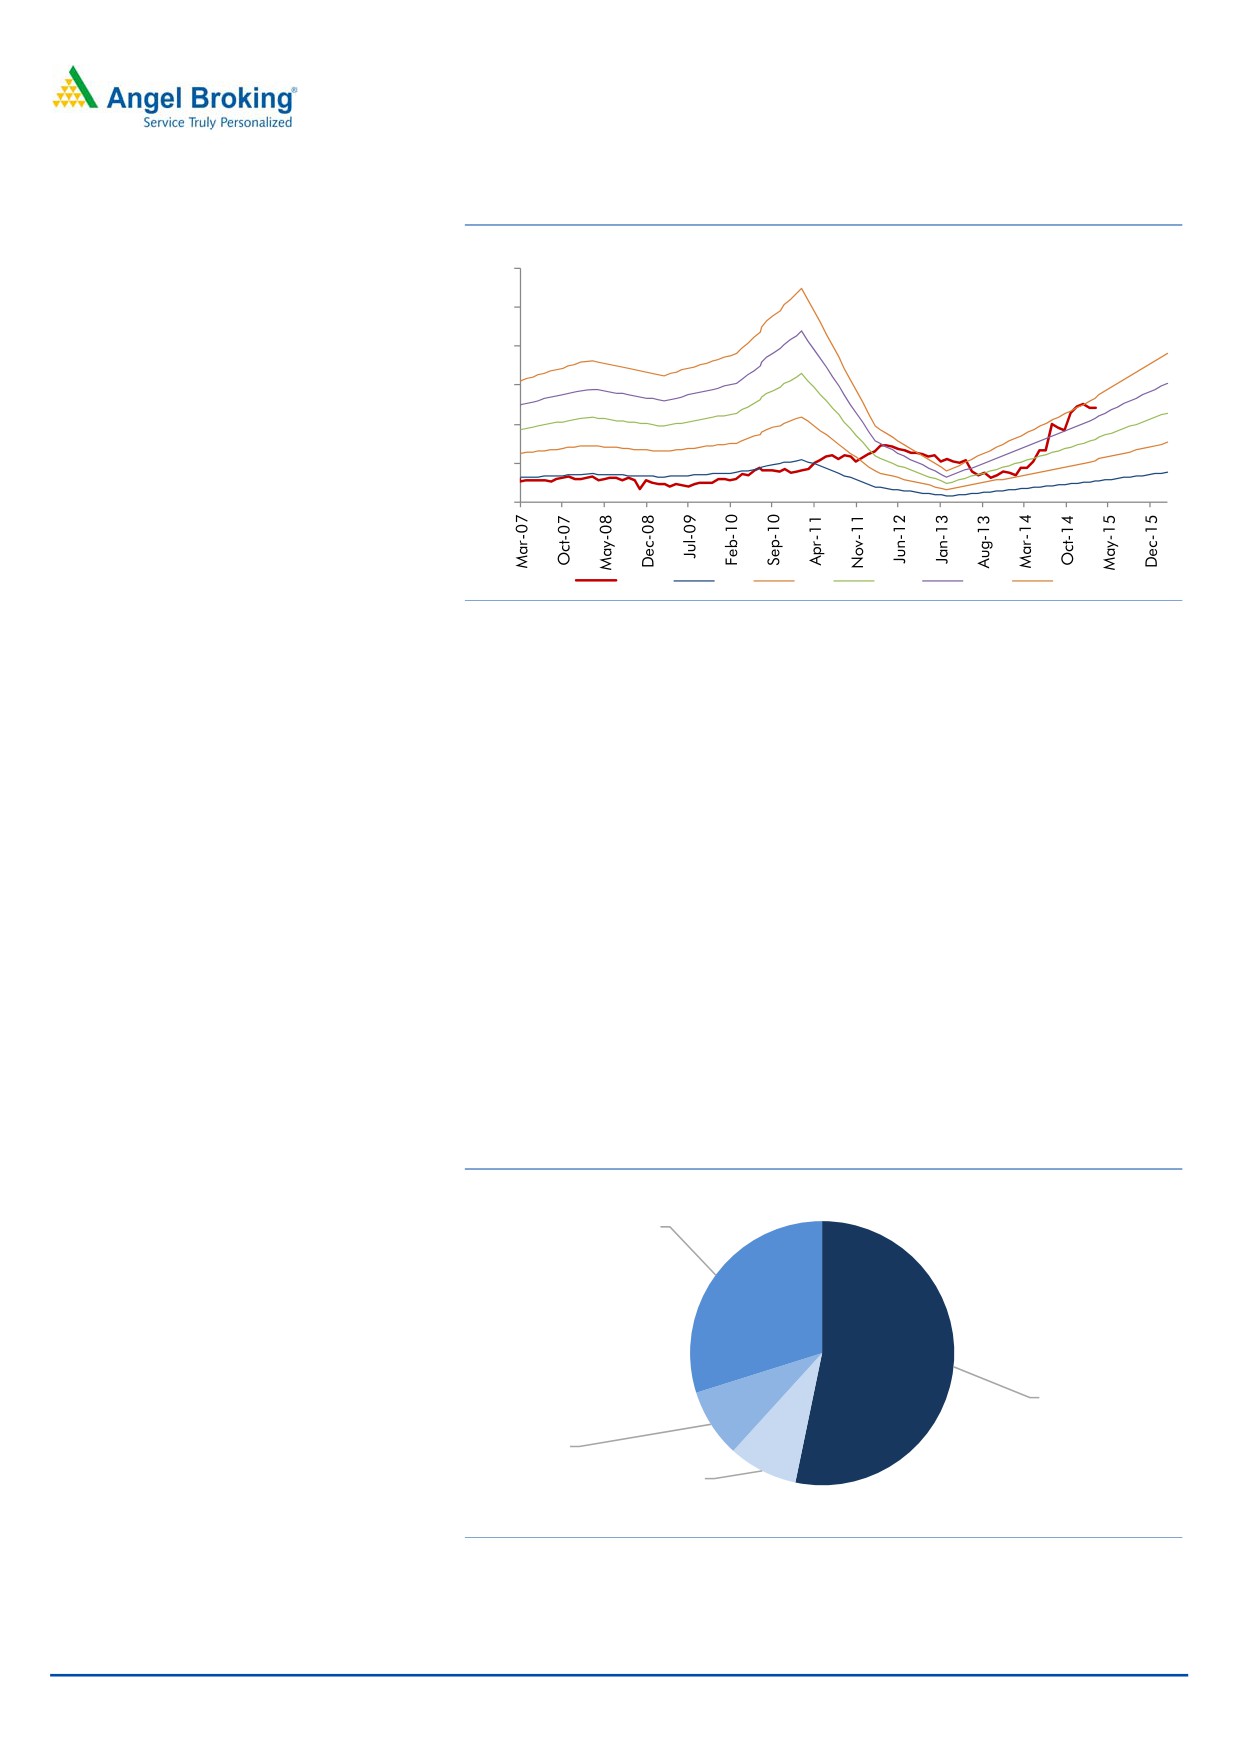
Exhibit 7: One-year forward P/E band
(`)
600
500
400
300
200
100
0
Price
4x
8x
12x
16x
20x
Source: Company, Angel Research
Company Background
Setco Automotive Ltd (SAL) is the largest manufacturer of clutches for commercial
vehicles. The company has a market share of 85% in the MHCV OEM segment,
supplying to majors like Tata Motors, Ashok Leyland, Volvo-Eicher, Bharat Benz,
Asia Motor Works and Mahindra & Mahindra. In the MHCV replacement segment,
SAL has a market share of about 65%. SAL’s products are sold under the “Lipe”
brand. It has four manufacturing facilities; two in India (Gujarat and Uttarakhand)
and one each in the US and the UK. Apart from commercial vehicles, SAL also
manufactures clutches for hydraulic products used in the construction equipment
industry and precision engineering components.
The replacement segment is the largest contributing segment accounting for about
62% of the overall revenues. Aftermarket sales through the OEM channel contribute
53% of the revenue while sales through the independent route contribute 9%. OEM
sales form 30% of the overall revenues while exports account for 9%.
Exhibit 8: Segment wise revenue break up
OEM, 30%
Aftermarket
(OES), 53%
Exports, 8%
Aftermarket
(Independent),
9%
Source: Company, Angel Research
March 13, 2015
6
Setco Automotive | Initiating Coverage
Profit & Loss Statement
Y/E March (` cr)
FY2012
FY2013
FY2014
FY2015E
FY2016E
FY2017E
Total operating income
423
399
390
565
718
862
% chg
19.9
(5.6)
(2.4)
45.0
27.0
20.0
Total Expenditure
348
343
352
496
623
739
Net Raw Materials
241
222
219
312
393
467
Personnel
40
46
52
70
83
98
Other
66
74
81
114
146
174
EBITDA
75
57
38
70
96
123
% chg
16.0
(24.7)
(33.4)
84.2
37.7
28.8
(% of Net Sales)
17.8
14.2
9.7
12.3
13.3
14.3
Depreciation & Amortisation
11
12
14
16
19
21
EBIT
68
49
34
53
77
102
% chg
20.0
(27.3)
(31.8)
58.8
44.7
32.7
(% of Net Sales)
16.0
12.3
8.6
9.4
10.7
11.9
Interest & other Charges
19
20
23
27
32
38
Other Income
3
5
9
12
14
16
PBT (recurring)
49
29
10
27
45
64
% chg
11.0
(39.8)
(65.4)
162.8
68.3
42.5
Extraordinary Expense/(Inc.)
(3)
0
8
0
0
0
PBT (reported)
46
29
18
27
45
64
Tax
1
3
0
4
9
14
(% of PBT)
1.3
11.2
(3.5)
15.0
21.0
21.0
PAT (reported)
45
26
18
23
36
51
ADJ. PAT
48
26
11
23
36
51
% chg
44.0
(45.9)
(59.6)
115.9
56.4
42.5
(% of Net Sales)
11.4
6.5
2.7
4.0
5.0
5.9
Basic EPS (`)
25.8
9.8
6.8
8.5
13.4
19.0
Fully Diluted EPS (`)
27.4
9.8
4.0
8.5
13.4
19.0
% chg
44.0
(64.2)
(59.6)
115.9
56.4
42.5
March 13, 2015
7
Setco Automotive | Initiating Coverage
Balance sheet statement
Y/E March (` cr)
FY2012 FY2013 FY2014 FY2015E FY2016E FY2017E
SOURCES OF FUNDS
Equity Share Capital
18
27
27
27
27
27
Reserves& Surplus
115
155
163
177
205
247
Shareholders Funds
133
182
189
204
231
274
Total Loans
142
173
178
220
270
305
Deferred Tax Liability
6
7
7
7
7
7
Other long term liab.
-
-
-
-
-
-
Long term provisions
1
1
1
1
1
1
Total Liabilities
282
362
375
432
509
587
APPLICATION OF FUNDS
Gross Block
154
202
230
270
310
350
Less: Acc. Dep.
52
65
80
97
115
136
Net Block
103
137
150
174
195
214
Capital WIP
12
14
8
8
8
8
Investments
22
37
51
61
68
74
Loans and adv.
33
40
46
56
72
86
Current Assets
207
214
216
270
344
416
Cash
9
3
5
5
7
6
Other
177
191
189
233
298
363
Current liabilities
74
59
75
106
138
164
Net Current Assets
133
155
141
164
206
252
Total Assets
282
362
375
432
509
587
March 13, 2015
8
Setco Automotive | Initiating Coverage
Cash flow statement
Y/E March (` cr)
FY2012
FY2013
FY2014
FY2015E FY2016E FY2017E
Profit before tax
46
29
18
27
45
64
Depreciation
16
13
15
16
19
21
Change in Working Capital
(39)
(28)
17
(23)
(41)
(47)
Others
2
1
0
(0)
0
0
Direct taxes paid
(1)
(3)
0
(4)
(9)
(14)
Cash Flow from Operations
24
13
51
16
14
25
(Inc.)/ Dec. in Fixed Assets
(32)
(49)
(22)
(40)
(40)
(40)
(Inc.)/ Dec. in Investments
(13)
(15)
(15)
(10)
(7)
(6)
(Inc.)/ Dec. in Loans & Adv
(7)
(7)
(6)
(0)
(7)
(6)
Cash Flow from Investing
(52)
(72)
(43)
(50)
(54)
(52)
Issue of Equity
0
9
0
0
0
0
Inc./(Dec.) in loans
38
31
5
42
50
35
Dividend Paid (Incl. Tax)
(8)
(8)
(8)
(8)
(8)
(8)
Others
4
22
(2)
0
0
0
Cash Flow from Financing
34
53
(5)
34
42
27
Inc./(Dec.) in Cash
5
(6)
2
0
2
(1)
Opening Cash balances
4
9
3
5
5
7
Closing Cash balances
9
3
5
5
7
6
March 13, 2015
9
Setco Automotive | Initiating Coverage
Key ratios
Y/E March
FY2012
FY2013
FY2014
FY2015E
FY2016E
FY2017E
Valuation Ratio (x)
P/E (on FDEPS)
8.8
24.7
61.2
28.3
18.1
12.7
P/CEPS
7.2
16.8
26.7
16.5
11.9
9.0
P/BV
3.2
3.6
3.4
3.2
2.8
2.4
Dividend yield (%)
1.7
1.1
1.1
1.3
2.1
2.9
EV/Sales
1.3
1.5
1.5
1.1
1.0
0.8
EV/EBITDA
7.5
10.5
15.9
9.2
7.2
5.9
EV / Total Assets
2.0
1.6
1.6
1.5
1.4
1.2
Per Share Data (`)
EPS (Basic)
27.4
9.8
4.0
8.5
13.4
19.0
EPS (fully diluted)
27.4
9.8
4.0
8.5
13.4
19.0
Cash EPS
33.5
14.4
9.1
14.6
20.3
26.9
DPS
4.0
2.7
2.7
3.2
5.0
7.1
Book Value
75.5
68.2
71.0
76.5
86.7
102.7
Dupont Analysis
EBIT margin
16.0
12.3
8.6
9.4
10.7
11.9
Tax retention ratio
1.0
0.9
1.0
0.9
0.8
0.8
Asset turnover (x)
1.5
1.1
1.1
1.3
1.4
1.5
ROIC (Post-tax)
24.5
12.2
9.4
10.6
12.1
13.9
Cost of Debt (Post Tax)
13.0
10.2
13.6
10.2
9.4
9.8
Leverage (x)
1.0
0.9
0.9
1.1
1.1
1.1
Operating ROE
35.9
14.0
5.6
11.0
15.3
18.4
Returns (%)
ROCE (Pre-tax)
24.0
13.6
9.0
12.3
15.1
17.4
Angel ROIC (Pre-tax)
24.8
13.7
9.1
12.5
15.4
17.6
ROE
36.3
14.4
5.6
11.2
15.4
18.6
Turnover ratios (x)
Asset Turnover (Gross Block)
2.7
2.0
1.7
2.1
2.3
2.5
Inventory / Sales (days)
76.7
101.5
111.7
88.7
89.4
91.6
Receivables (days)
76.4
72.6
65.4
62.0
62.0
62.0
Payables (days)
63.5
53.7
70.1
68.4
70.2
69.4
WC cycle (ex-cash) (days)
107.4
139.1
126.9
102.3
101.2
104.2
Solvency ratios (x)
Net debt to equity
1.0
0.9
0.9
1.1
1.1
1.1
Net debt to EBITDA
1.8
3.0
4.6
3.1
2.7
2.4
Interest Coverage (EBIT / Int.)
3.6
2.5
1.4
2.0
2.4
2.7
March 13, 2015
10
Setco Automotive | Initiating Coverage
Research Team Tel: 022 - 39357800
DISCLAIMER
Angel Broking Private Limited (hereinafter referred to as “Angel”) is a registered Member of National Stock Exchange of India Limited,
Bombay Stock Exchange Limited and MCX Stock Exchange Limited. It is also registered as a Depository Participant with CDSL and
Portfolio Manager with SEBI. It also has registration with AMFI as a Mutual Fund Distributor. Angel has received in-principal approval
from SEBI for registering as a Research Entity in terms of SEBI (Research Analyst) Regulations, 2014. Angel or its associates has not
been debarred/ suspended by SEBI or any other regulatory authority for accessing /dealing in securities Market. Angel or its associates
including its relatives/analyst do not hold any financial interest/beneficial ownership of more than 1% in the company covered by
Analyst. Angel or its associates/analyst has not received any compensation / managed or co-managed public offering of securities of
the company covered by Analyst during the past twelve months. Angel/analyst has not served as an officer, director or employee of
company covered by Analyst and has not been engaged in market making activity of the company covered by Analyst.
This document is solely for the personal information of the recipient, and must not be singularly used as the basis of any investment
decision. Nothing in this document should be construed as investment or financial advice. Each recipient of this document should
make such investigations as they deem necessary to arrive at an independent evaluation of an investment in the securities of the
companies referred to in this document (including the merits and risks involved), and should consult their own advisors to determine
the merits and risks of such an investment.
Reports based on technical and derivative analysis center on studying charts of a stock's price movement, outstanding positions and
trading volume, as opposed to focusing on a company's fundamentals and, as such, may not match with a report on a company's
fundamentals.
The information in this document has been printed on the basis of publicly available information, internal data and other reliable
sources believed to be true, but we do not represent that it is accurate or complete and it should not be relied on as such, as this
document is for general guidance only. Angel Broking Pvt. Limited or any of its affiliates/ group companies shall not be in any way
responsible for any loss or damage that may arise to any person from any inadvertent error in the information contained in this report.
Angel Broking Pvt. Limited has not independently verified all the information contained within this document. Accordingly, we cannot
testify, nor make any representation or warranty, express or implied, to the accuracy, contents or data contained within this document.
While Angel Broking Pvt. Limited endeavors to update on a reasonable basis the information discussed in this material, there may be
regulatory, compliance, or other reasons that prevent us from doing so.
This document is being supplied to you solely for your information, and its contents, information or data may not be reproduced,
redistributed or passed on, directly or indirectly.
Neither Angel Broking Pvt. Limited, nor its directors, employees or affiliates shall be liable for any loss or damage that may arise from
or in connection with the use of this information.
Note: Please refer to the important `Stock Holding Disclosure' report on the Angel website (Research Section). Also, please refer to the
latest update on respective stocks for the disclosure status in respect of those stocks. Angel Broking Pvt. Limited and its affiliates may
have investment positions in the stocks recommended in this report.
Disclosure of Interest Statement
Setco Automotive
1. Analyst ownership of the stock
No
2. Angel and its Group companies ownership of the stock
No
3. Angel and its Group companies' Directors ownership of the stock
No
4. Broking relationship with company covered
No
Note: We have not considered any Exposure below ` 1 lakh for Angel, its Group companies and Directors
Ratings (Returns):
Buy (> 15%)
Accumulate (5% to 15%)
Neutral (-5 to 5%)
Reduce (-5% to -15%)
Sell (< -15%)
March 13, 2015
11